Research
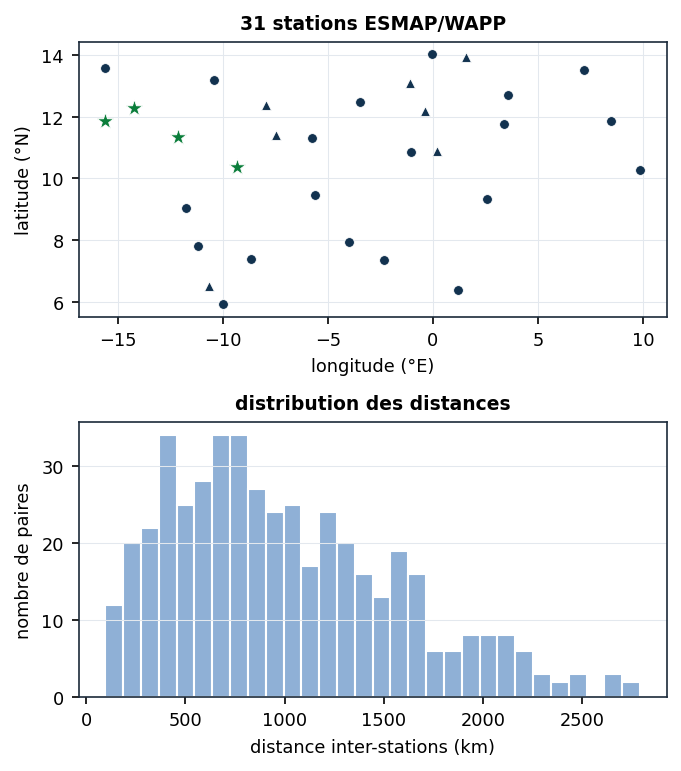
My ongoing work on solar radiation data in West Africa: how far a ground calibration stays valid away from the station that produced it, and what a satellite product erases where its grid cell is too coarse.
Spatial calibration of solar radiation
The transferability of a ground calibration is governed by climatic similarity between sites, not by geographic distance.
Progress. Analysis complete over the 31 stations and 930 pairs, confirmed on two independent satellite products (CAMS then SARAH-3), then mapped across West Africa. Article write-up in progress.
At a glance
- 31
- ESMAP/WAPP stations
- 930
- source-target pairs
- 2
- independent products
- +0.32
- residual vs Δclim (GHI)
The problem
Satellite products (GHI, DNI) are locally biased; they are corrected by calibrating against ground measurements. But measurement stations are scarce in West Africa, and sizing is almost always done far from any station.
The question: is a calibration established at one station transferable elsewhere, and by what criterion? Common intuition assumes geographic proximity governs transferability. This work tests the competing hypothesis: it is the climatic similarity between sites, written , that governs it: two sites with close climates but geographically distant calibrate one another better than two neighbours with different regimes.
Hypotheses
The transferability of a calibration is governed by climatic similarity between sites, not by their geographic distance.
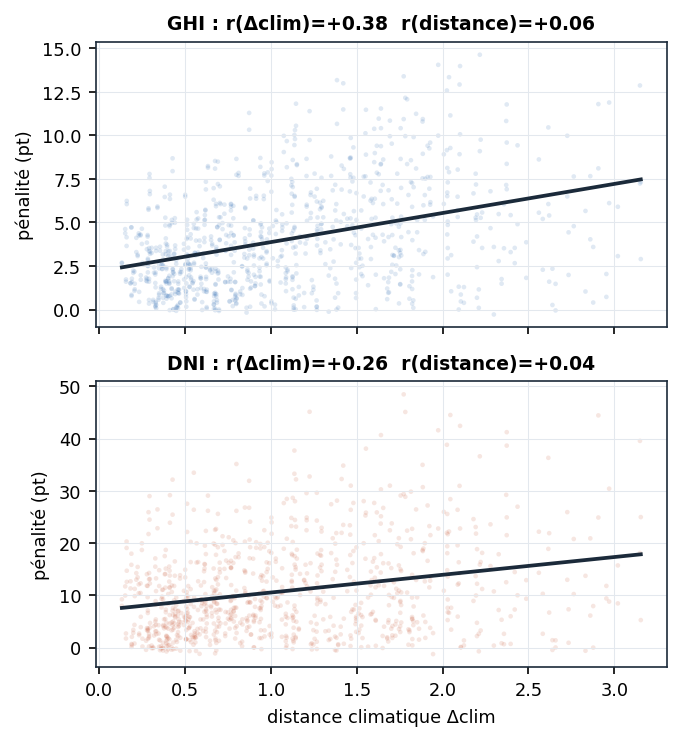
The transfer residual grows with , and this law is stable from one independent satellite product to another.
Accounting for aerosol (AOD) enriches the law and reduces the transfer residual.
Method & maths
A network of 31 stations, i.e. 930 ordered source–target pairs. For each pair, the product is calibrated on the source (bias correction by quantile matching), the calibration is applied to the target, and the residual is measured. The residual is then compared against two competing distances: geographic distance and climatic distance .
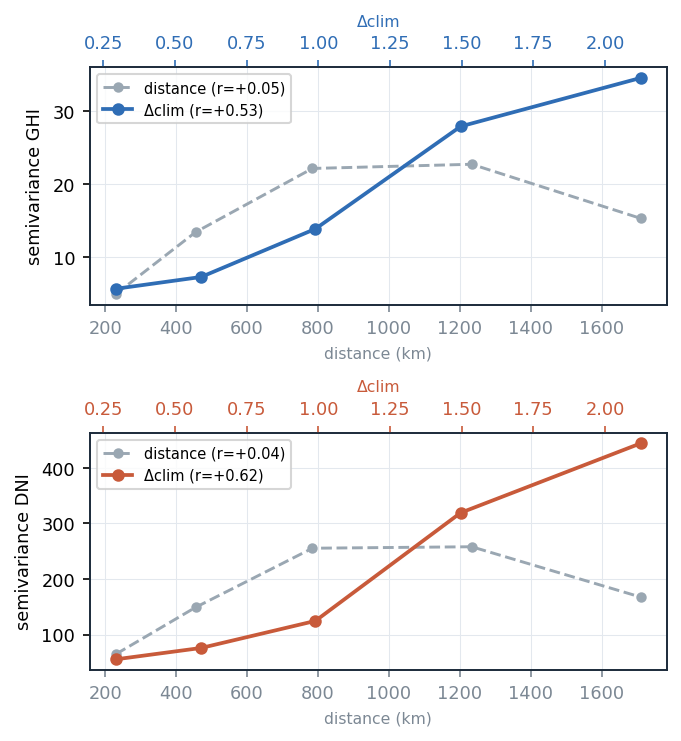
Tools: a relationship between residual and , a variogram pitting climate against distance, station-by-station cross-validation, an aerosol-aware enriched version, then replication on a second independent product (SARAH-3 after CAMS) and a map of West Africa at 1° resolution. The whole thing follows a deterministic pipeline, traced to the formulas and independently checked.
Results & figures
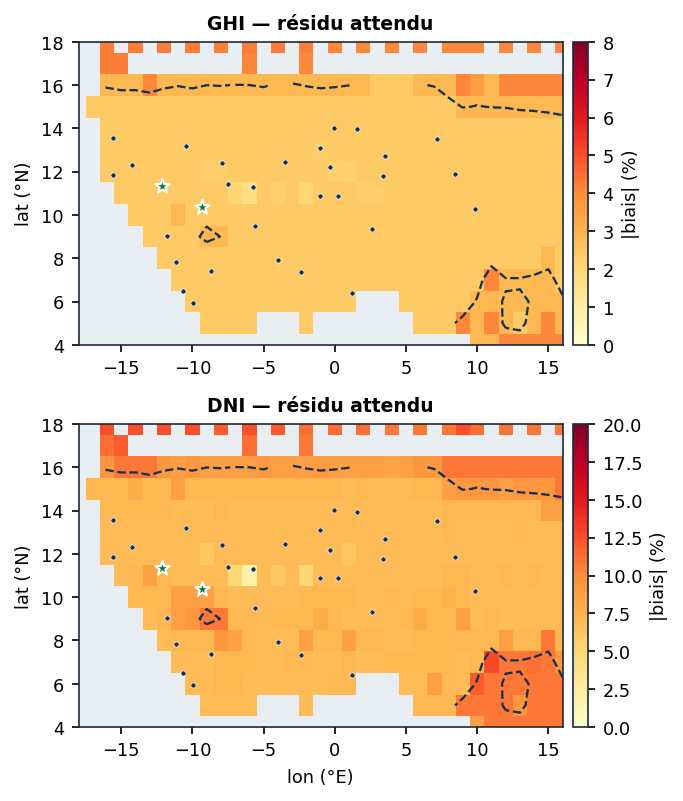
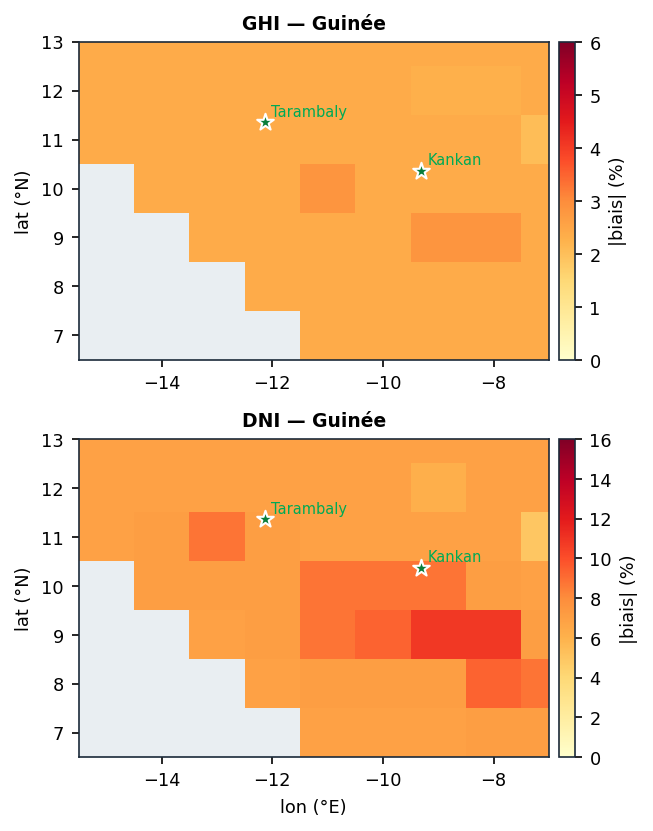
Transferability is indeed governed by and not by distance: the climatic variogram structures the residual where geographic distance does not. The result is validated on 31 stations and 930 pairs, with two independent satellite products (CAMS, SARAH-3), then mapped across West Africa, applied to the ESMAP/WAPP network, the Guinea case, with a field anchor at Kankan (ESMAP/WAPP campaign).
The resulting method, CLIM3, calibrates each site on its three best climatic analogues, weighted by the inverse of . On Guinea, it brings the expected residual down to 2.4% for GHI and 6.9% for DNI. A few stations well spread across climate zones are then enough to cover a territory, provided the least-instrumented areas are validated locally.
Open questions
- 01DNI stays the least well-constrained component: its climatic trend is there, but still depends on the satellite product. It needs evidence as strong as GHI's.
- 02The result rests on a two-year window, a single network and a single region: beyond that, generality remains to be shown.
- 03The map is validated station by station, with no ground measurement inside a cell: a short campaign in a target zone would confirm it.
- 04The aerosol optical depth comes from a coarse reanalysis; a finer product would sharpen .
Pixel degeneracy of solar products
Naming and quantifying the case where a satellite product assigns the same value to genuinely distinct sites, and measuring where spatial information is erased.
Progress. Diagnosis established on NASA POWER (34 communes of Guinea); extension to finer products and article write-up to come.
At a glance
- 34
- communes of Guinea
- 22
- distinct values
- 20
- co-celled communes
- 504
- identical months (42 yrs)
The problem
A satellite or reanalysis product delivers radiation on a grid. Two genuinely distinct sites that fall into the same cell receive the same value, to the byte. The founding note documented this on a single pair: Kindia and Mamou, 92 km apart and 378 m in altitude, to which NASA POWER assigns strictly identical series over decades.
This work generalises the observation from a pair to a territory, and quantifies it: how much spatial information a product erases over Guinea, and where. The phenomenon is named here pixel degeneracy: a product's inability to tell apart genuinely distinct sites because they share a cell.
To be distinguished from the spatial representativeness of a ground measurement (Hakuba 2013, Schwarz 2018) and from resource interpolation: this is not a point-to-area error, it is an intrinsic property of the product, measured against a reference of real sites.
Hypotheses
At NASA POWER's resolution (1°), a substantial share of the 34 communes share their cell and receive byte-identical series.
Degeneracy decreases with cell size: strong for NASA POWER (1°), lower for ERA5 (0.25°), negligible for fine products (CAMS, SARAH-3, ERA5-Land).
The erased separations are not harmless: co-celled communes differ in altitude and regime, hence in genuinely distinct resource.
Where the coarse product is degenerate, fine products separate the sites but disagree on the sign of the difference: the real gap exists without being resolved by satellite alone.
Method & maths
For a set of sites, a product tiles space into cells and assigns each commune to the cell containing it. Identity property, verified rather than assumed: the product returns an identical series to all sites in one cell.
Degeneracy indicators are defined from the number of distinct values (occupied cells):
The rate if the product resolves every site, and if it collapses them all: it is the fraction of spatial information lost. We also measure the maximal collapse and, for each shared cell, the erased separation (geographic distance and altitude range).
Deterministic pipeline: raw data read from disk, outputs dated and traceable down to the computation.
Indicators
Results
On NASA POWER and the 34 communes, only 22 distinct values are returned:
A third of the spatial information is erased: 20 of 34 communes share their cell, only 14 are resolved alone. Within each shared cell, the monthly GHI series are strictly identical over 504 months (42 years), without exception.
The note's Kindia-Mamou case is in fact a triplet with Dalaba, erasing 371 m of altitude range over 97 km; the coastal cell collapses the capital and three neighbouring prefectures into a single value. A telling irony: NASA POWER knows different altitudes for these sites (289 m, 660 m) yet gives them the same radiation. Hypotheses and are established.
Key result
Open questions
- 01Extend the diagnosis to ERA5-Land, CAMS then SARAH-3 and show that degeneracy decreases as the cell tightens ().
- 02On the pairs NASA POWER conflates, measure whether fine products agree on the sign of the inter-site difference ().
- 03Define an effective resolution: the cell size below which degeneracy vanishes on this reference.
- 04Add ERA5 at 0.25° as an intermediate resolution point between 1° and ~5 km.